
UK posting times, 2026
Best time to post in the UK, across eight platforms
Almost every posting time calculator online is built on United States data. This one runs on UK clock time and asks seven questions instead of three, because a bar in Leeds posting Reels to 18 to 24 year olds and a recruitment firm posting articles to 50 plus do not share a best time.
Free, no sign up, nothing sent to us
The tool itself is free forever. The plans are what it looks like when we run the schedule, film the content and report on it.
The tool
Seven questions, then your week
Platform and format first, because a carousel and a Reel do not peak together. Then who you are, who you are talking to and what you want them to do. Every answer changes the grid.
Your best posting windows
Times shown in UK clock time
Platform comparison
Same industry, audience and goal, two different platforms
Your whole week, hour by hour
Darker means stronger. Scores are relative to your own best hour, which is always 100, rather than an absolute engagement rate.
Your posting schedule
What the grid is telling you
Read these before you schedule anything
Why this is different
Three questions is not enough to answer this
The old version of this tool asked for platform, industry and audience: 96 possible answers. It now asks seven questions and can return 306,176 different weeks. That is not a bigger dropdown for its own sake. Each axis was added because it genuinely moves the peak, and here is what each one does.
- 01UK clock time, not United States averages
Every window is UK local time, with a toggle for GMT and BST so you can see both. A schedule built on US data puts your best post at 2pm on a Wednesday, which in Britain is the middle of the working afternoon.
- 02Content format, which nothing else asks
A LinkedIn article and a LinkedIn video do not share a peak. Nor do an Instagram carousel and an Instagram Reel. Format is the axis that changes the answer most and the one almost every free tool ignores.
- 03Twenty six industries, split where it matters
Hotels, restaurants, and bars and pubs are three separate rows rather than one hospitality average, because a bar peaks Thursday to Saturday evening and a hotel peaks Thursday and Sunday. Averaging them describes neither.
- 04Objective, because reach and sales are different jobs
The hour that gets you the most views is rarely the hour that gets you the most enquiries. Choosing sales and enquiries pulls the schedule towards intent hours and away from the late night scroll.
- 05Audience age, which shifts everything late
An 18 to 24 audience is still awake and scrolling at midnight and barely present at seven in the morning. A 50 plus audience is the reverse. This single answer can move your best window by four hours.
- 06Eight regions, not one overseas option
United States East and West coasts are five hours and eight hours behind, and treating them as one audience gives you a window that suits neither. Ireland, Europe, the Middle East and Australia each get their own overlap shift.
The output changes with them. Selecting a different platform alone produces between fourteen and twenty nine genuinely different peak windows depending on what else you choose, which is the test that matters: if the extra questions did not move the answer, they would only be decoration.
The same argument, in our own work
Six pieces we filmed, in six different industries
The reason this tool splits industries apart is that we shoot for all of them and watch the numbers afterwards, from the Snaptrip Group travel portfolio to salons, restaurants and hotels. A salon Reel, a wellness routine, an ice cream shot and a hotel room reveal do not perform at the same hour on the same day. Click any to play, nothing loads until you do.
A salon visit
Filmed at Headmasters
BeautyA daily routine
Supplement brand, 44 seconds
Fitness and wellnessIce cream, close up
The format that travels furthest
Food and drinkA morning at home
Homeware, shot as a ritual
Home and interiorsA hotel room reveal
Filmed on a working stay
HotelsShort form creative
36 seconds, built for the feed
E-commerceAll six were filmed and edited by the two of us. If you want the same content made for your brand rather than only the schedule for it, the UGC portfolio is the full library.
How to actually use this
Treat the windows as a starting hypothesis rather than a rule. Post inside them for four to six weeks, then open your own analytics and look at which slots produced the strongest first hour. Your real peak is usually within an hour or two of the recommendation rather than identical to it, and once you have found it you should stop moving.
The mistake we see most
Posting twice in one day, once in the morning and once in the evening, then wondering why both underperformed. Both Instagram and TikTok weight the opening period of a post heavily, and two posts in a day split the same audience across two openings. Pick one window a day and be boring about it. Consistency at a slightly wrong hour beats variety at the right one.
What a schedule cannot fix
Timing sets a ceiling. It does not raise the floor. If a post would have been ignored at nine in the evening it will also be ignored at eight, and no calculator changes that. The honest order of operations is content first, cadence second, timing third. Anyone selling timing as the main lever is selling the easiest thing to sell rather than the thing that works.
Where the account level version lives
This tool gives you the industry baseline. Your own analytics give you the account truth, and the gap between them is where most of the gain sits. Instagram shows follower activity under Insights, TikTok under Creator tools, and LinkedIn under analytics on a company page. If you would rather someone read those numbers with you, the free social media audit is the next tool along, and social media management UK is what it looks like when we run the schedule for you.
Monthly plans
When you would rather we ran the schedule

Small Business Social Pack
£149 per month
12 static posts, 1 platform, content creation done for you
View Small Business Social Pack- Most chosen



Rolling monthly, 2 months notice, no setup fees. All plans on the social media management page.
Featured UGC portfolio
The content that fills the schedule



Every category is on the UGC portfolio hub.
Frequently asked questions
Both matter, in that order. Timing sets the ceiling and content decides where under it you land. Every major platform weights the opening period of a post heavily, so content published when your audience is asleep starts from a standing position it usually cannot recover from. Good content at a poor hour still beats poor content at a good one.
For most UK accounts the strongest Instagram windows sit on Tuesday, Wednesday and Thursday evenings between seven and nine, with a secondary lunchtime peak around midday. That is the general shape. The tool above narrows it by format, industry, audience and objective, and those four answers routinely move the peak by two hours or more.
TikTok runs later than Instagram and holds up far better at weekends. Evening windows from seven to ten hold across the week, and Friday and Saturday nights stay strong where Instagram falls away. TikTok also keeps distributing content for days rather than hours, so a missed peak costs less there than anywhere else.
Not if you schedule in your device's local time, because your clock already moves. If your scheduling tool asks for a fixed zone, choose Europe slash London rather than GMT, so it follows the change automatically. The clock selector in the tool lets you see either version.
Because format changes the answer more than industry does. Short video is consumed in the evening and on the sofa. Carousels and articles are read at a desk in the morning. A tool that gives a LinkedIn newsletter and a LinkedIn Reel the same posting slot is averaging two different behaviours into one wrong number.
Three to five times a week suits most brands on Instagram, and TikTok tolerates more. Set the frequency in the tool and the schedule returns exactly that many slots rather than a full week you will not keep to. Consistency beats volume: three posts a week every week outperforms seven posts one week and nothing the next.
No. The window is wider than the number suggests, and seven and half past seven behave almost identically. Publishing fifteen to thirty minutes ahead of the peak is often slightly better, because it gives the platform time to test the post on a small group before the main wave arrives.
Choose the East or West coast option rather than a single United States setting, because the two are five and eight hours behind and a window that suits one misses the other. The tool then shifts you towards genuine overlap hours, at the cost of some UK evening reach.
The curves are a model rather than a measurement. They combine published 2026 platform and industry benchmarks with the posting patterns we observe running client accounts. Scores are an index against your own peak hour, not a predicted engagement rate, and the methodology section states the limits plainly.
No. The entire calculation runs in your browser. There is no sign up, no email field, and your selections are never transmitted anywhere. The calendar file is generated on your device too.
People are on their phones at weekends, but they engage with brand content less. The effect is strongest on LinkedIn, where Saturday and Sunday are close to dead, and weakest on YouTube and Pinterest, which both improve at weekends. Travel, hotels and gaming also hold up, which is why the industry answer changes the weekend shape.
Yes, and freelancers and agencies do. Run it per client, copy the schedule or download the calendar file, and keep the settings you used so the next review starts from the same baseline. There is no limit and no attribution required.
Our channels
If you would rather watch than read
Velena and Dragos
Travel, food and influencer content from the two of us, and the channel where the long form work lives.
Open the channelVelena Lifestyle
The agency channel. UGC examples, client work and finished campaign videos.
Open the channel
Methodology, and what this tool cannot tell you
What it is. A model, not a measurement. Eight platform base curves shaped by day of week, then adjusted by content format, industry, audience region, objective and audience age. The curves are built from published 2026 platform and industry benchmarks combined with the posting patterns we observe running client accounts across travel, hospitality, beauty, wellness and e-commerce.
What the numbers mean. Every score is an index against your own strongest hour, which always reads 100. It is not a predicted engagement rate and it is not a percentage of anything. No public dataset can tell you what your specific account will do at nine on a Tuesday, and any tool presenting a decimal engagement rate for your unseen account is presenting a guess with false precision.
What it cannot do. It cannot see your followers, your content or your history. It cannot account for a post that lands during a national event, a platform outage or your own competitor posting the same thing an hour earlier. And it cannot rescue content that would not have worked anyway.
How to beat it. Your own follower activity data, in Instagram Insights, TikTok Creator tools or LinkedIn analytics, is better than this tool and always will be, because it is about you. Use this to start, then let your own numbers overrule it.
The rest of the free tools
Ten tools, all built for the UK market, all free with no sign up and no email capture. Nothing here is a trial.
- Instagram engagement rate calculatorYour real rate against 2026 UK benchmarks, by industry and follower tier
- Free social media auditThirty weighted questions, a grade and your five highest impact fixes
- Hashtag generatorThirty tags in three tiers, with UK niche tags and banned tag warnings
- Bio generatorFive structurally different bios with live character counts per platform
- UGC rate calculatorWhat to charge and what to pay, by niche, deliverables and usage
- Social media ROI calculatorROAS, CPC and CPA against UK benchmarks with a traffic light report
- UTM link builderTag any link so analytics shows which post actually drove the click
- QR code generatorLinks, text and Wi-Fi turned into a high resolution PNG for print
- Image converterBatch convert between JPEG, PNG, WebP and AVIF in your browser
- The whole libraryEvery free tool in one place, with new ones added regularly
Client reviews
What clients say, word for word
“Velena Lifestyle have been a breath of fresh air for our social media accounts. Their professionalism and knowledge have supported us massively.”
Sean Thompson, Head of Marketing, Snaptrip Group. Google review, 5.0.“If you want a self-starter with the ability to think strategically and minimize the time between ideation and creation, Velena is your go-to. She has done a phenomenal job with managing our UGC portfolio, curating and creating our content.”
Naila Abbasova, Enara Wellness. Google review, 5.0.“Velena was a pleasure to work with, she worked solely with the brief provided and was even ahead of her deadline. The content produced was clean, professional and on brand. We would love to work with Velena again in the very near future.”
Lauryn Middleton, Social Media Manager, Smirk. Client testimonial, October 2023.Every review is reproduced word for word. Read them all on the reviews page.
The two of us
Who built this tool
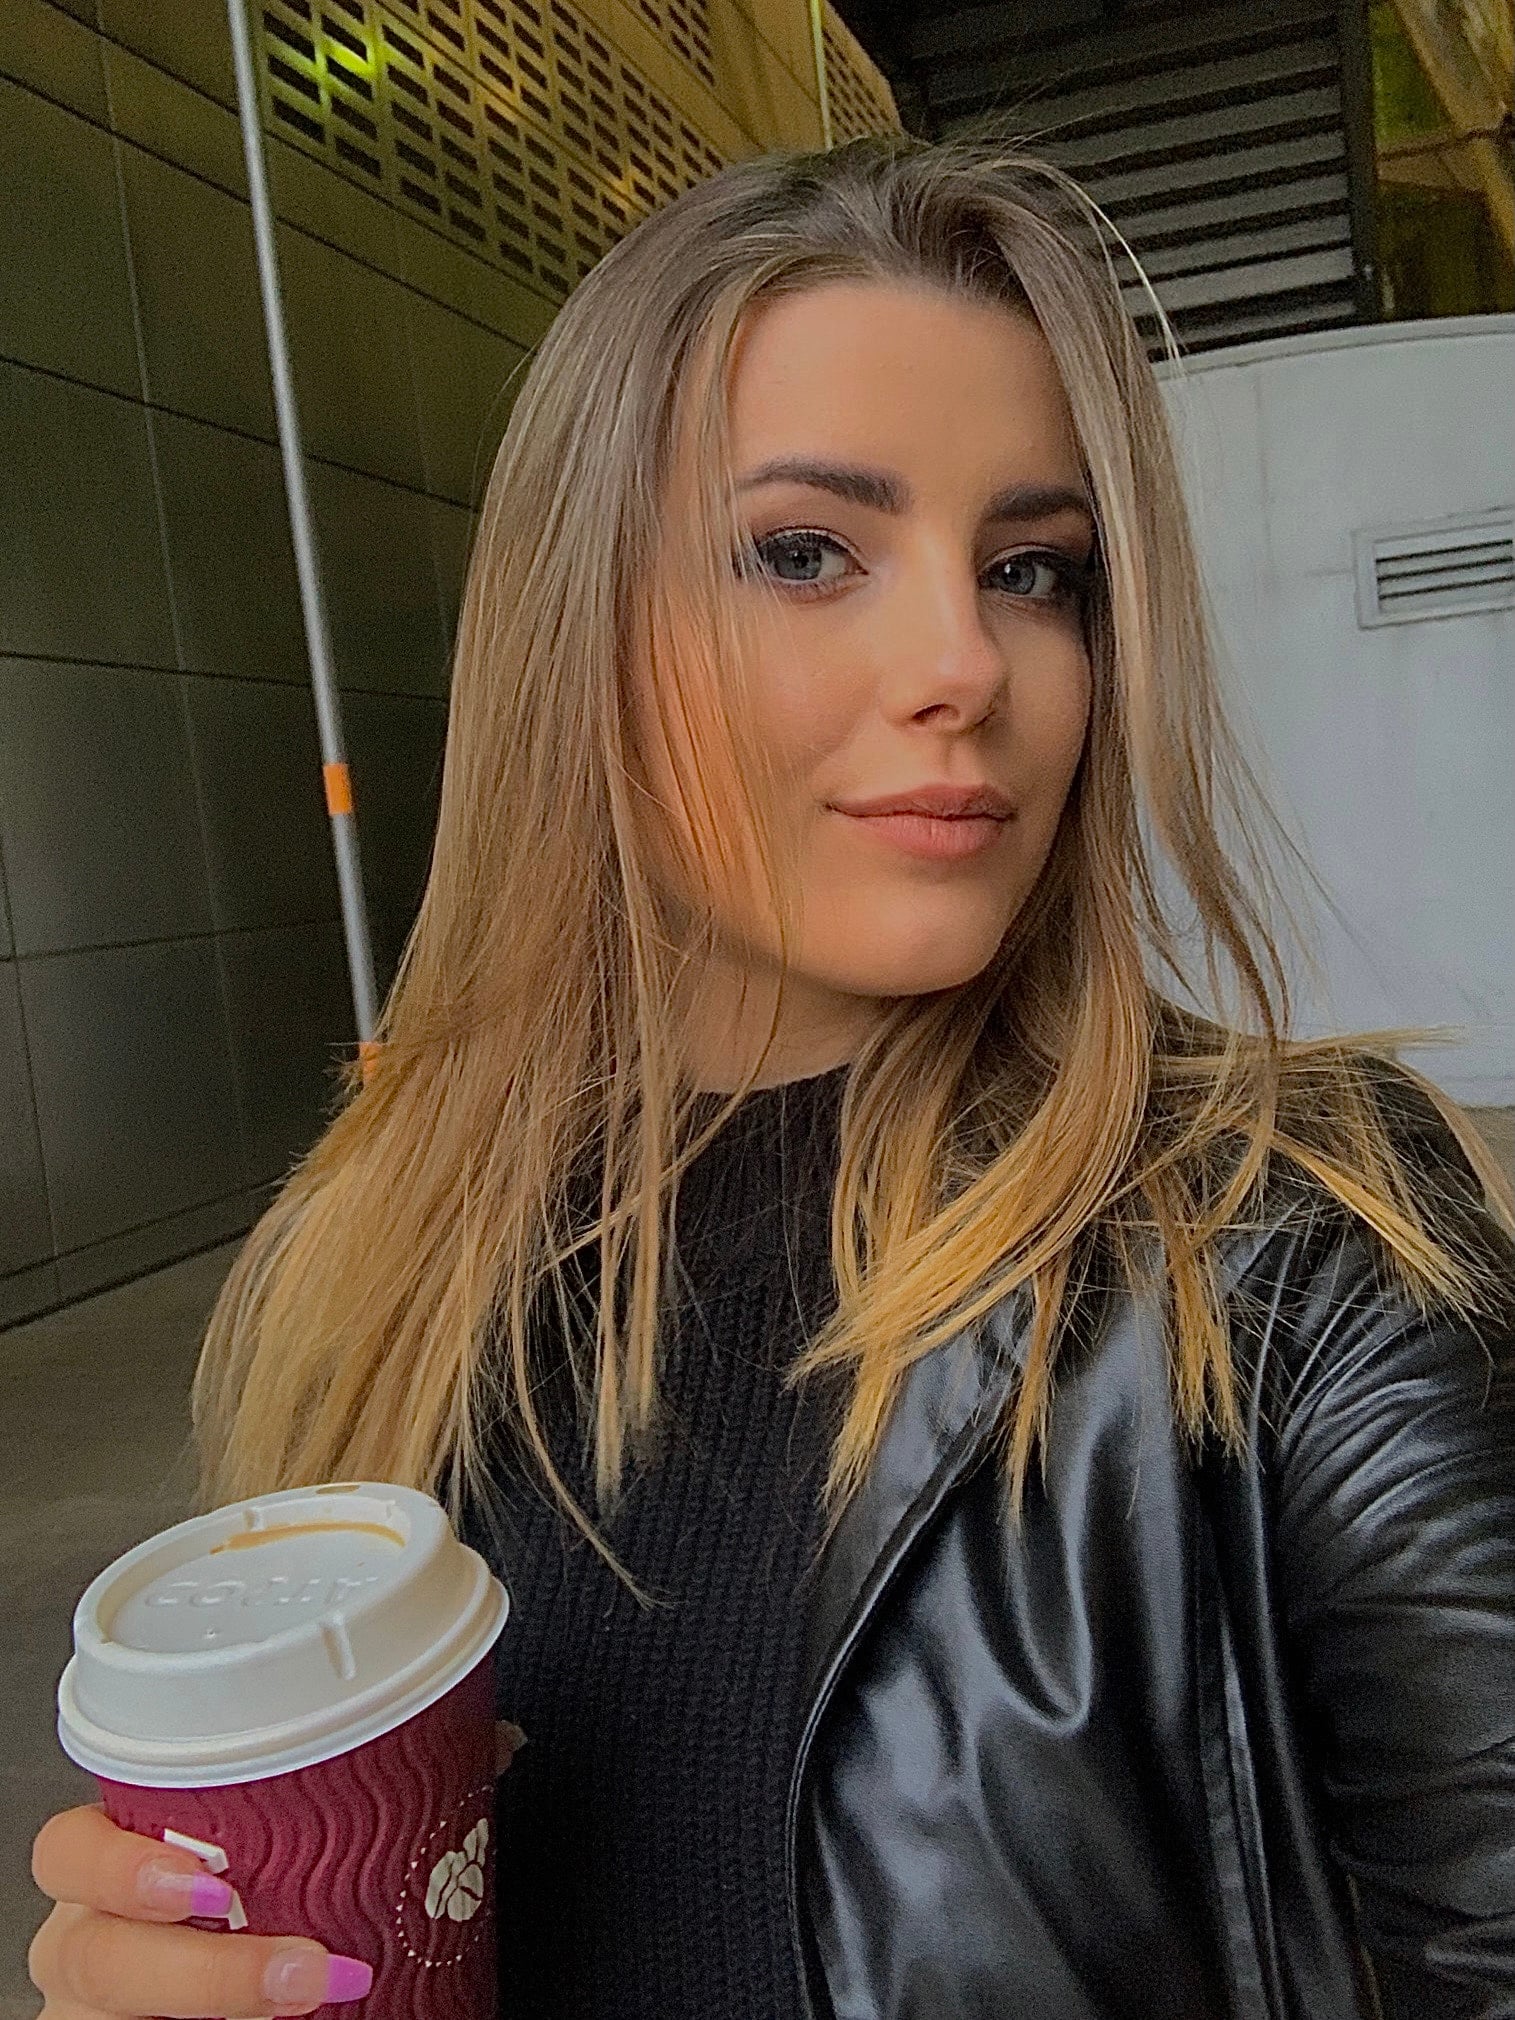
Velena Nikolova
Co-Founder and Creative Director
Velena Nikolova is Creative Director and the person on camera. A lifestyle creator featured in Women's Health, she films and edits the content behind every schedule we run. More on the about page.

Dragos Nistor
Co-Founder and Business Strategist
Dragos Nistor handles strategy, scheduling and the numbers, and built the model behind this tool. Named a LinkedIn Top Entrepreneurship Voice in 2024. More on the case studies.
A schedule is the easy half
Knowing when to post takes a minute. Having something worth posting every week for a year is the part that beats most brands. We have worked with 100+ brands since 2022 and currently run eleven accounts end to end, filming, writing, publishing and reporting. Tell us what your feed looks like and we will say plainly whether you need us. We reply within one business day, and nothing is filmed or scheduled until the brief is agreed in writing.